IT services
Server-side monitoring
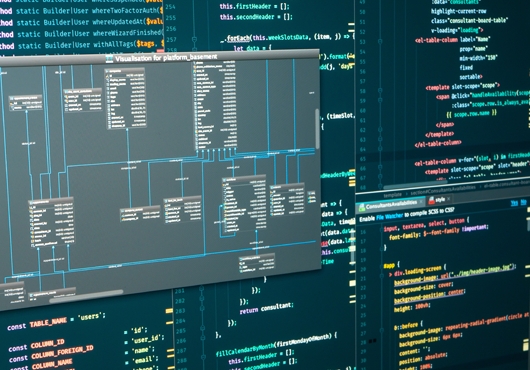
Through automated real-time monitoring, the internal call topology of the back-end application is visualized and combined with its performance diagnosis, business analysis and other functions, it can quickly conduct business troubleshooting, and improve the time to locate the root cause of the problem to the second level.
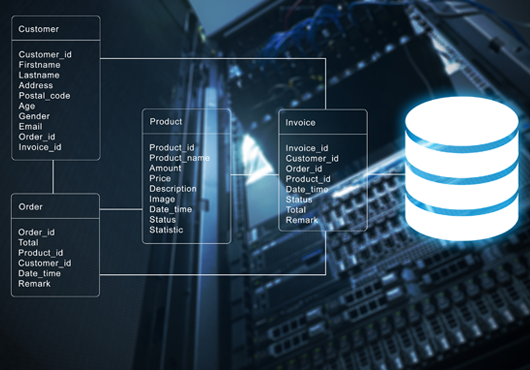
Apply the visualization of the global topology, quickly grasp the overall operating status of the application
Code-level application server performance monitoring, rapid business troubleshooting, root cause location of second-level problems

Sort out the business execution logic through the web transaction portal, automatically restore business calling relationships
Ai can automatically discover web transaction entry and visualization of topology, which can help users to automatically associate many individual services in the application according to business execution logic, so as to accurately evaluate the quality of business services.

A single user requests call chain tracking, fast realization of fault domain isolation for business performance bottlenecks
The call chain tracking records the call details of a single user's slow request across the entire application link, including the code execution status of each node in the call path, database performance, etc. Through the automatic restoration of a single user request to call the link, you can quickly locate the faulty node that affects business performance, and you can drill down to find the code-level cause in depth.
Intelligent code depth tracking, quickly and accurately locate the root cause of the problem
When the application has performance problems, Ai can be combined with the dynamic baseline function to obtain the complete request operation status at the first time, including code execution, database calls, third-party interfaces, etc., to locate the problem more accurately and efficiently.

User service monitoring is combined with host container monitoring, omnidirectional assisted positioning problem
The host container data collection frequency is as low as once a minute. It monitors more than ten indicators such as CPU, memory, disk, network, Load Average, TCP connection, file open count, and real-time linkage of web transactions with indicators, which can quickly locate application faults the root cause, real-time understanding of the running status of the host container.

Custom transactions implement user operations and back-end services logical aggregation and splitting to accurately monitor user business
Through the custom transaction function, Ai aggregates requests with the same characteristics (for example, with the same parameter name and the same URI) to form relevant monitoring data and call links. At the same time, Ai can also split a composite request (different back-end services through different parameters) to achieve more accurate monitoring of user transactions.
Product advantages
Server monitoring ensures stable IT, quality services, and proactive issue prevention.

Real-time alerts and issue resolution
Server monitoring detects and alerts IT teams, speeding issue resolution, minimizing downtime, and improving availability.

Performance optimization and resource management
Server monitoring optimizes resources for efficiency, lowering costs, and improving performance.

Fault prediction and prevention
Advanced server monitoring predicts issues, empowering proactive prevention, reducing failures, and ensuring stability.